
Are you a Joomla user leveraging the powerful Route 66 SEO Analyzer, but wish for a more immediate, visual summary of your content's health? The native list of results is great, but wouldn't a real-time score and gauge graph make content editing faster and more intuitive?
I have created a lightweight, self-contained JavaScript snippet that taps directly into Route 66's output, giving you an instantaneous visual status right in the Joomla article editor. Best of all, it uses inline SVG, meaning no external libraries (like Google Charts) are needed, keeping your editor fast and avoiding conflicts with tricky content filters like those in JCE.
How It Works: The Magic of SVG Gauges
The key to this solution is the combination of jQuery's DOM manipulation and native browser features:
- Real-Time Monitoring: We use the powerful native MutationObserver API. This tells the script to instantly run a refresh function whenever the Route 66 results list (#route66-analyzer-seo-results) changes. As you type, the analyzer updates its results, and our script updates the gauge!
- No External Charts: Instead of loading a massive chart library, we draw the gauge using simple Scalable Vector Graphics (SVG). A circle is used as the track, and another circle's arc is dynamically drawn over it using the stroke-dasharray CSS property. This is calculated to show the exact percentage of Good vs. Bad results.
- Smooth Animation: The updates are applied using requestAnimationFrame, ensuring the small percentage changes are animated smoothly and don't slow down the browser while you're editing.
Implementation (Joomla Template/Module)
Since editors like JCE often strip out scripts, the safest place for this code is in a Custom HTML Module set to a position near the article or in your Joomla template's main HTML file. Remember to disable editor filtering for the user group accessing the module.
Copy this snippet and add it to your administrator dashboard.
jQuery(function () { const $target = jQuery('#route66-analyzer-seo-results'); // Insert counters + empty gauges (percent will be set dynamically) $target.before(`
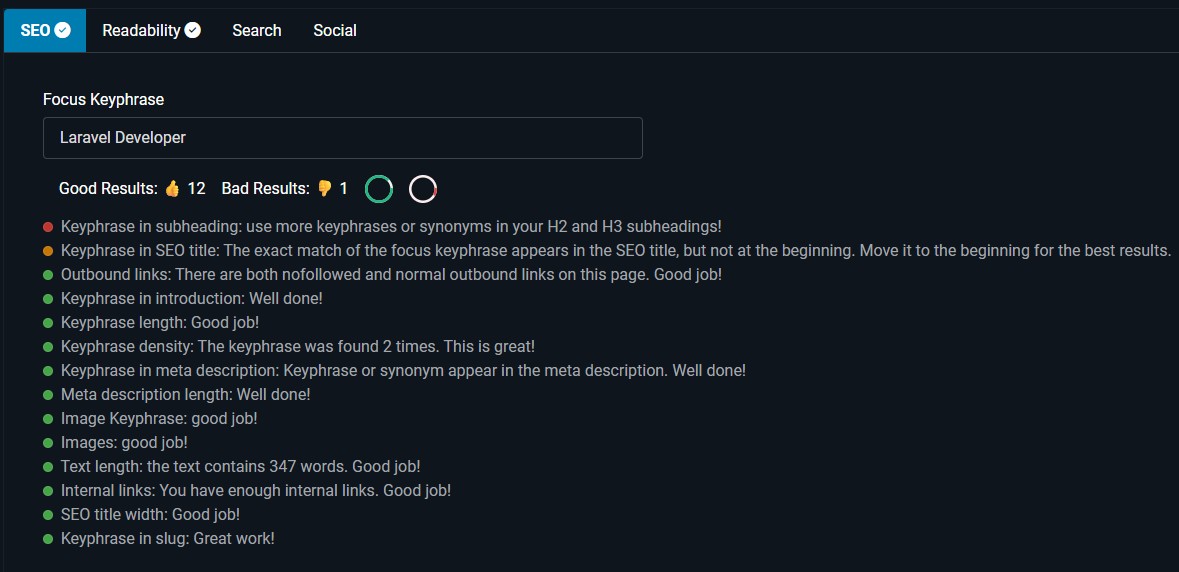
`); const targetNode = $target.get(0); // helper: round nicely const pct = (value) => Math.max(0, Math.min(100, Math.round(value))); // helper: set/animate a gauge const updateGauge = (gaugeEl, percent, opts) => { if (!gaugeEl) return; const svg = gaugeEl.querySelector('svg'); const arc = svg?.querySelector('circle:nth-of-type(2)'); if (!arc) return; // Size: use data-size (px) or fallback to 44 const size = Number(gaugeEl.dataset.size) || 44; gaugeEl.style.width = size + 'px'; gaugeEl.style.height = size + 'px'; // Colors (optional override) if (opts?.bg) svg.querySelector('circle:nth-of-type(1)')?.setAttribute('stroke', opts.bg); if (opts?.fg) arc.setAttribute('stroke', opts.fg); const r = Number(arc.getAttribute('r')) || 20; const circumference = 2 * Math.PI * r; const length = (circumference * percent) / 100; // A11y/title svg.setAttribute('aria-label', `${opts?.label || 'Gauge'}: ${percent}%`); svg.setAttribute('title', `${opts?.label || 'Gauge'}: ${percent}%`); // Animate requestAnimationFrame(() => { arc.style.transition = 'stroke-dasharray 600ms ease, opacity 150ms ease'; arc.style.strokeDasharray = `${length} 9999`; arc.style.opacity = '1'; }); }; const goodGauge = document.querySelector('[data-role="gauge-good"]'); const badGauge = document.querySelector('[data-role="gauge-bad"]'); const refresh = () => { const totalItems = jQuery('.route66-analyzer-result', targetNode).length; const goodItems = jQuery('.route66-analyzer-result-icon.good', targetNode).length; const badItems = jQuery('.route66-analyzer-result-icon.bad', targetNode).length; //jQuery('#total-count-display').text(`Total Results: ${totalItems}`); jQuery('#good-count-display').text(`Good Results: 👍 ${goodItems}`); jQuery('#bad-count-display').text(`Bad Results: 👎 ${badItems}`); const goodPercent = totalItems ? pct((goodItems / totalItems) * 100) : 0; const badPercent = totalItems ? pct((badItems / totalItems) * 100) : 0; updateGauge(goodGauge, goodPercent, { label: 'Good', bg: '#E9F8F2', fg: '#23B681' }); updateGauge(badGauge, badPercent, { label: 'Bad', bg: '#FBEDED', fg: '#D44949' }); }; // Only in editor layout (keep your original condition) if (targetNode && jQuery('body').hasClass('layout-edit')) { const observer = new MutationObserver(() => refresh()); observer.observe(targetNode, { childList: true, subtree: true }); refresh(); // initial } else { // If not in edit layout, still render once refresh(); } });
This simple addition transforms your Route 66 list into a dashboard, giving you immediate feedback that helps you hit that green score faster!


