Data Integrity Redefined: The Convergence of Project Management and Real-Time Business Intelligence
The operational gap in project management is defined by the delay between a time entry being logged and that cost being reflected in a financial report.
This gap is closed only by time-consuming, error-prone manual data consolidation.
This application’s architecture was designed to eliminate that delay entirely, delivering a single, unified platform where execution data is automatically cross-referenced with financial vital data.
I. Eliminating the Spreadsheet Bottleneck
The platform's core value is its ability to ingest, consolidate, and analyze data that typically lives in disparate systems, thereby removing the administrative workload and risk associated with manual data transfer:
Ingestion (Import): Data fragmentation is proactively solved through the Bulk Import Engine. This engine provides ready-to-use templates and architectural compatibility for integration with external project systems (Jira, Asana, Trello, Monday.com, ClickUp) and generic data sources (CSV/XLSX). This ensures all user, team, and financial rate data is clean and centrally housed from the start.
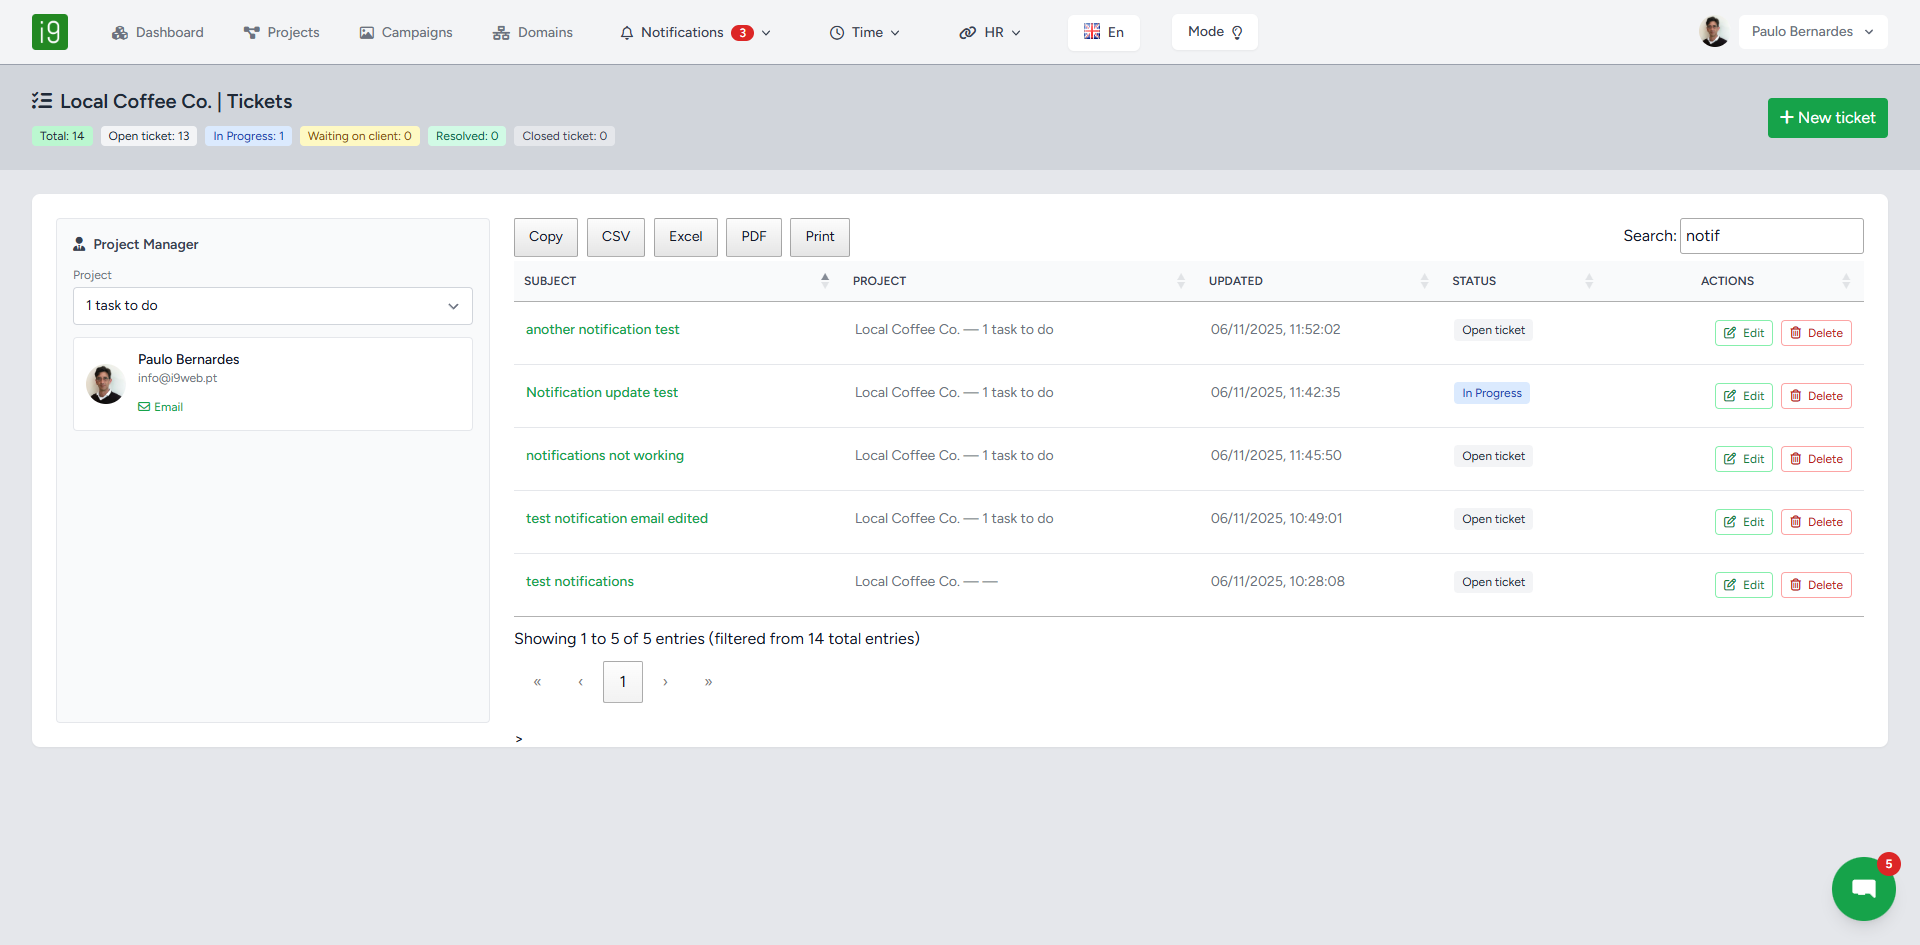
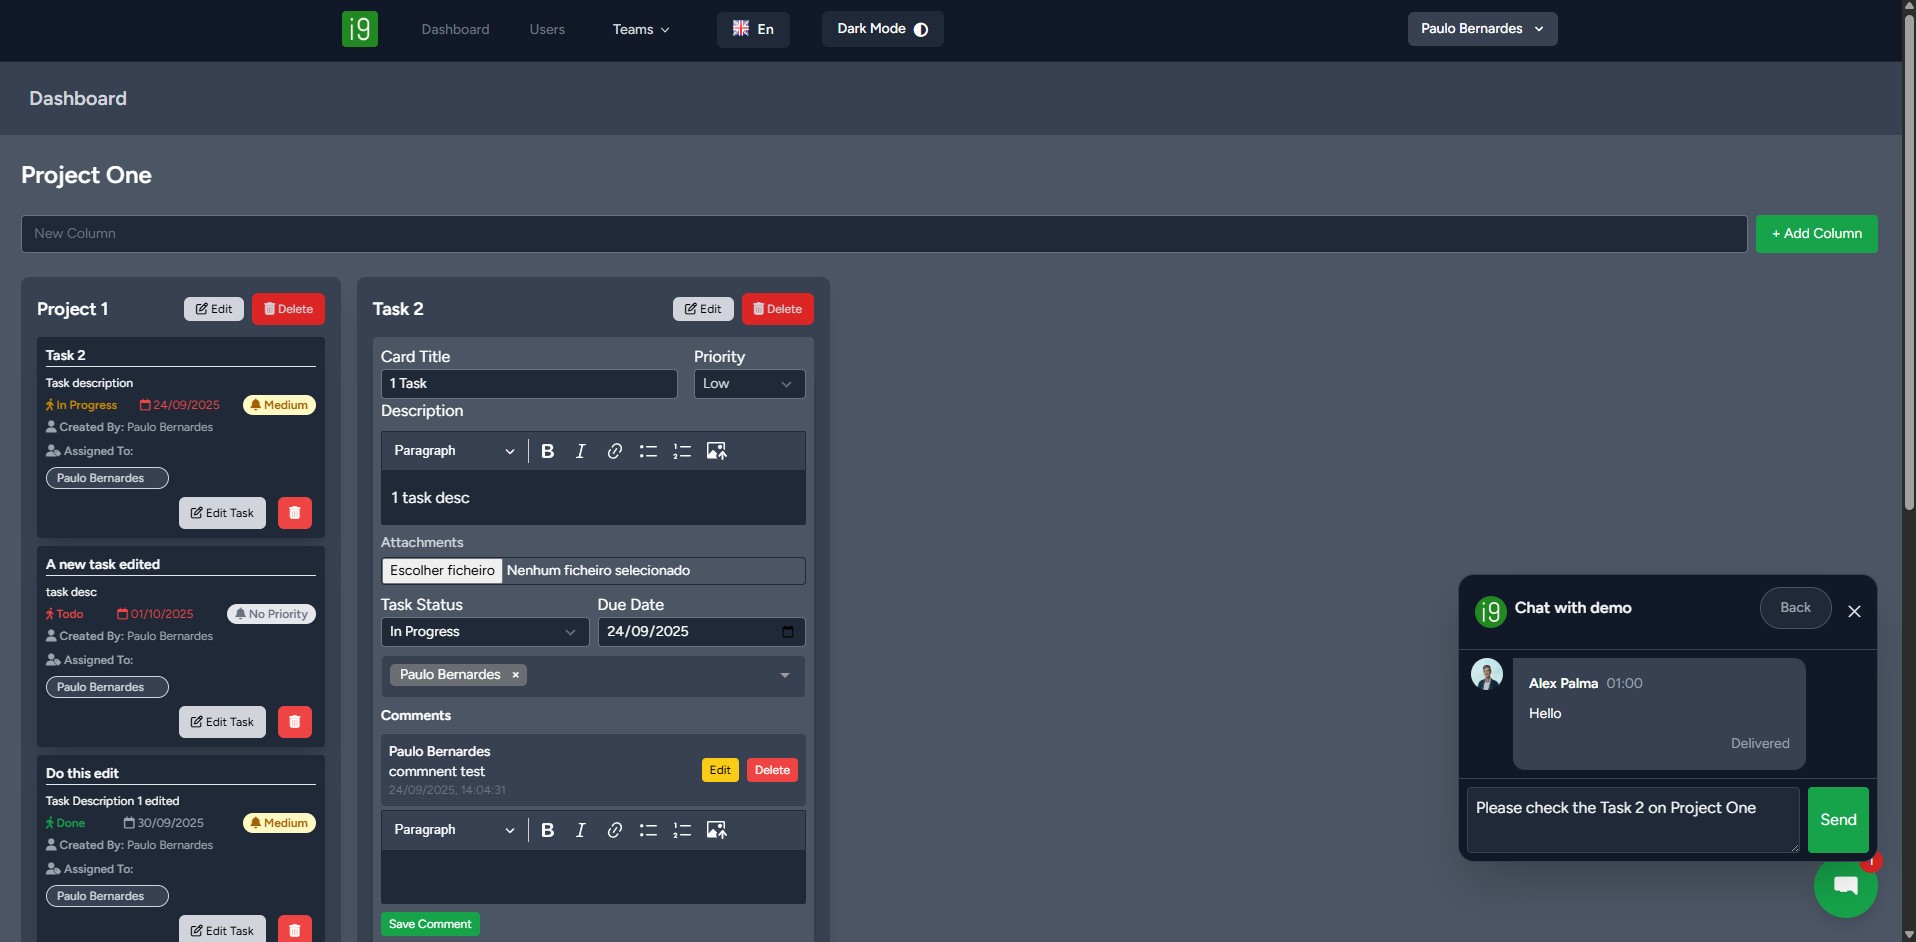
Execution (PRM Core): The system integrates Kanban Boards, Time Entries, Holiday Requests, and a Real-Time Chat module. This consolidation ensures that all project activity, resource utilization, and communication occur on the same ledger, guaranteeing data consistency.
II. Real-Time, Cross-Data Intelligence
The intelligence layer transforms raw activity into actionable insights through dynamic, cross-entity analysis:
Financial Health Dashboards: A full hierarchy of dashboards provides instant clarity at every level:
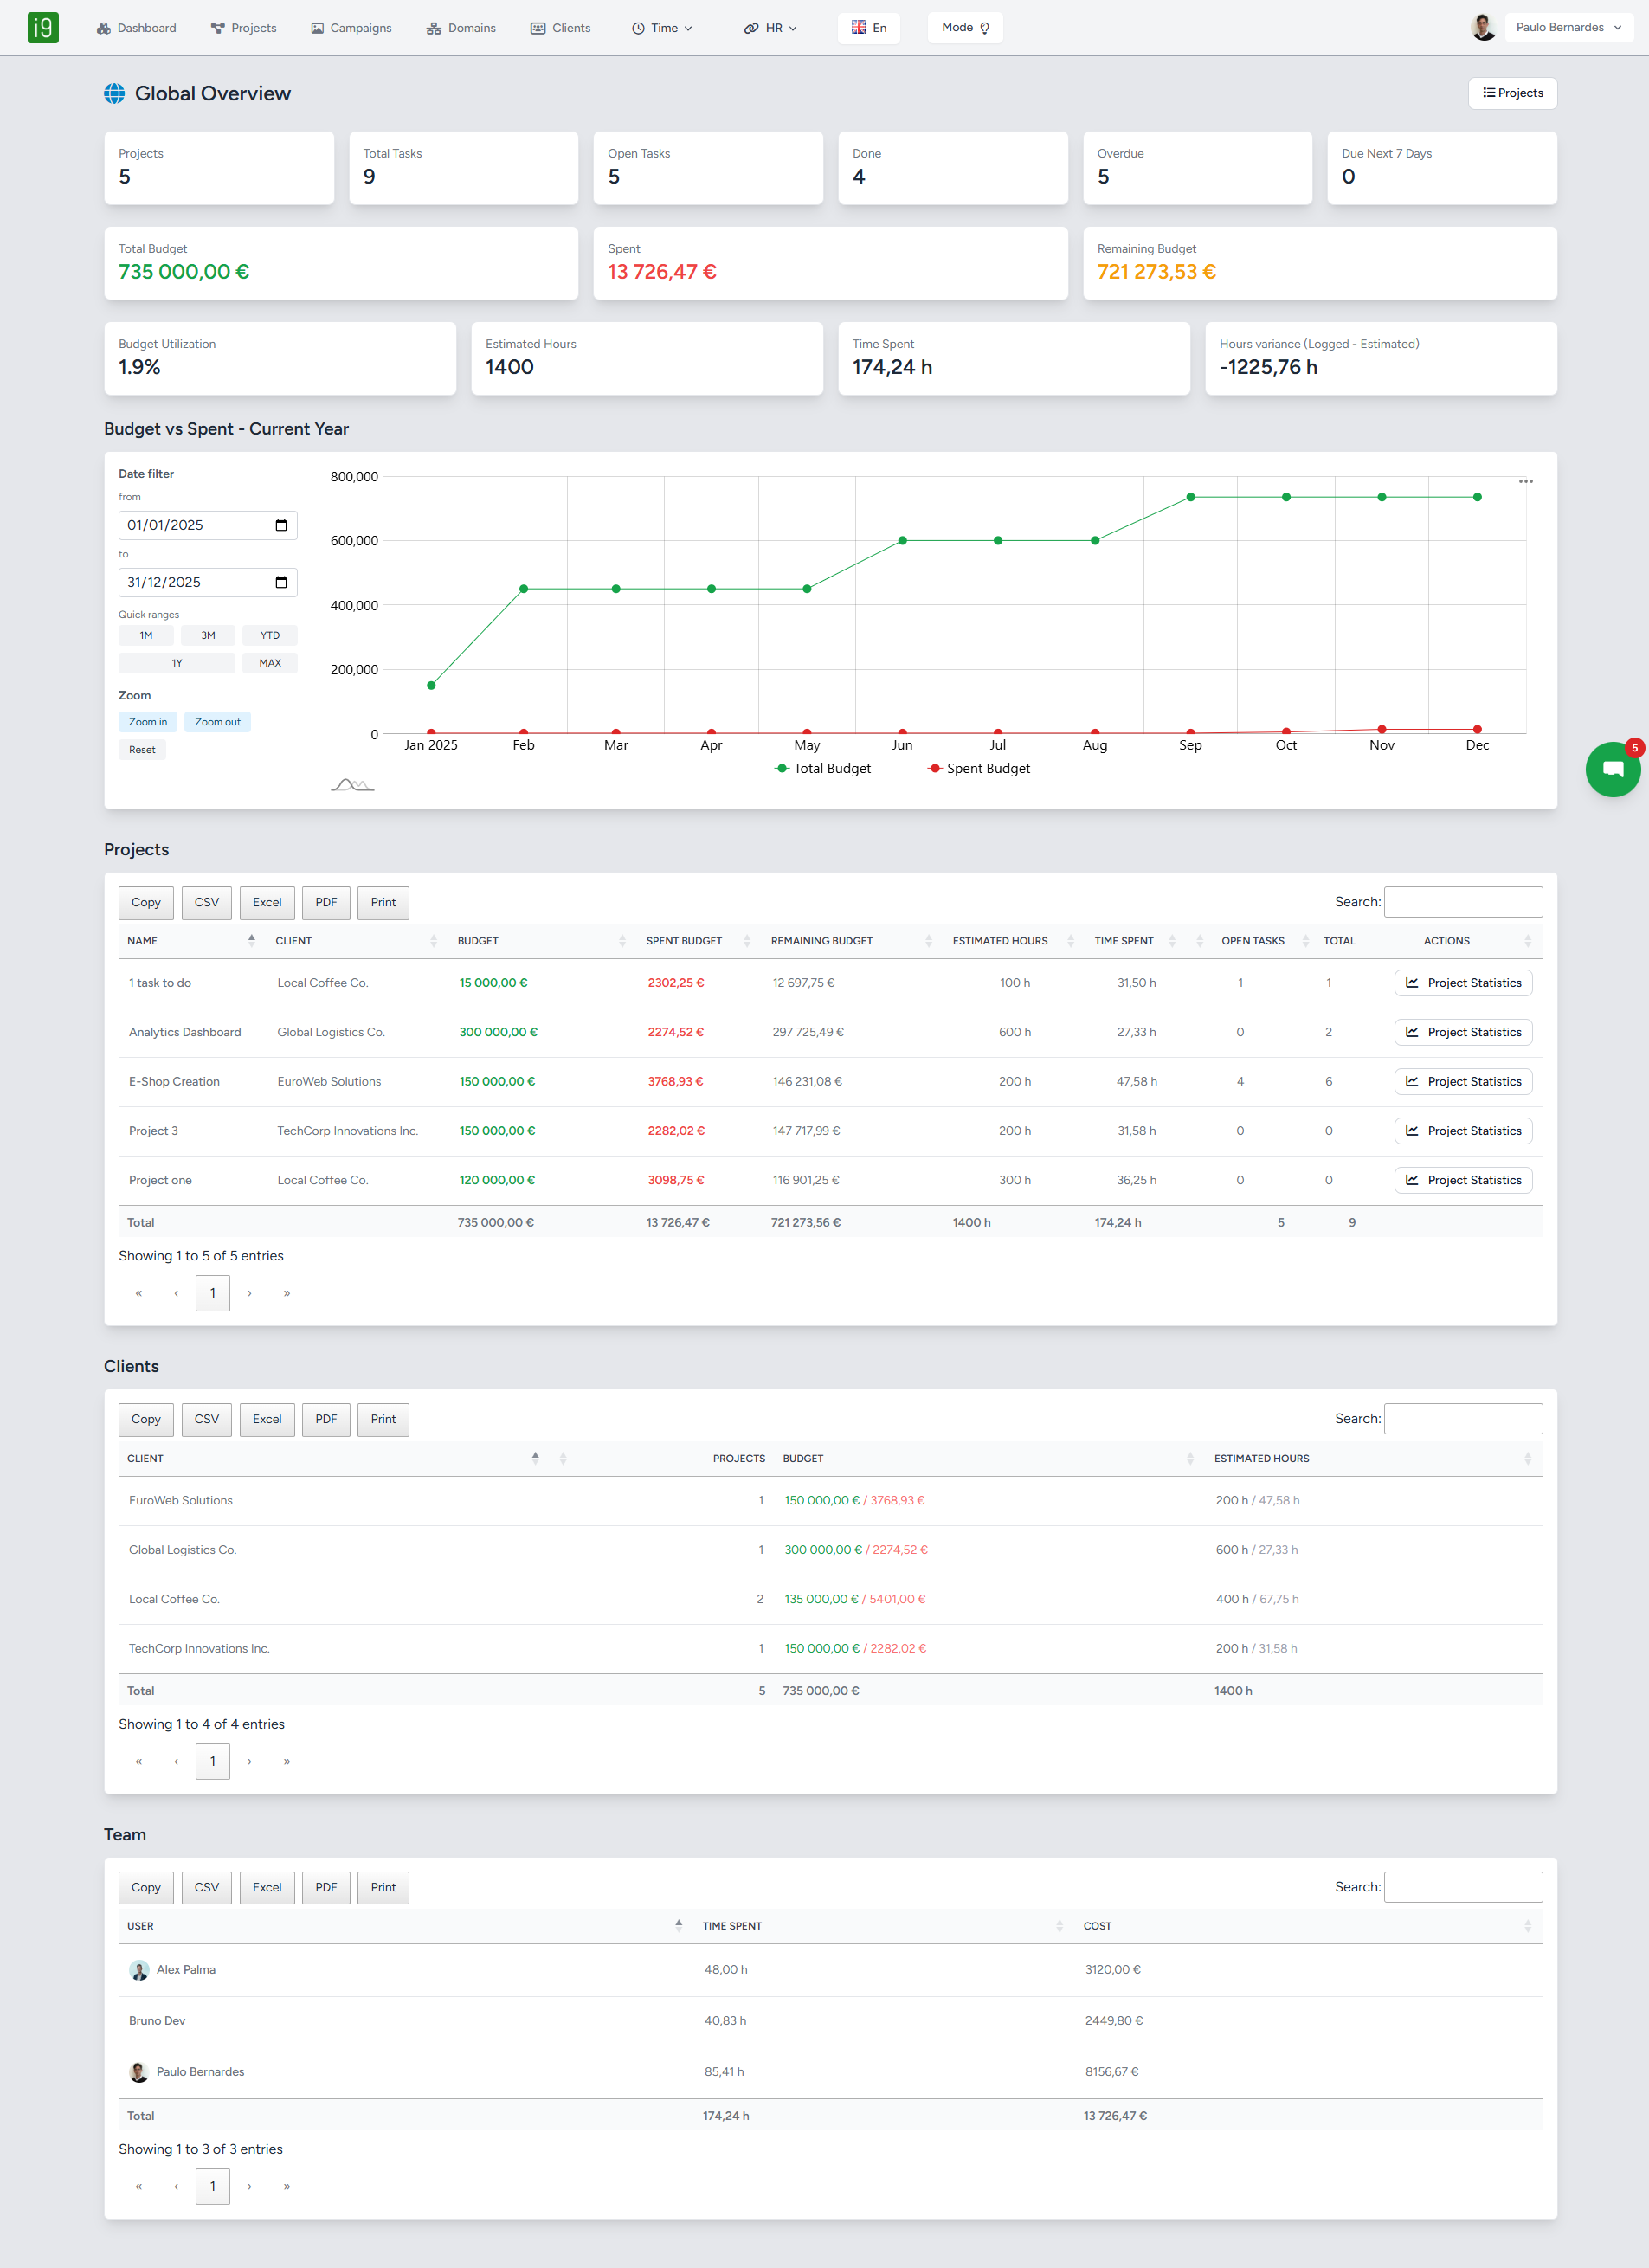
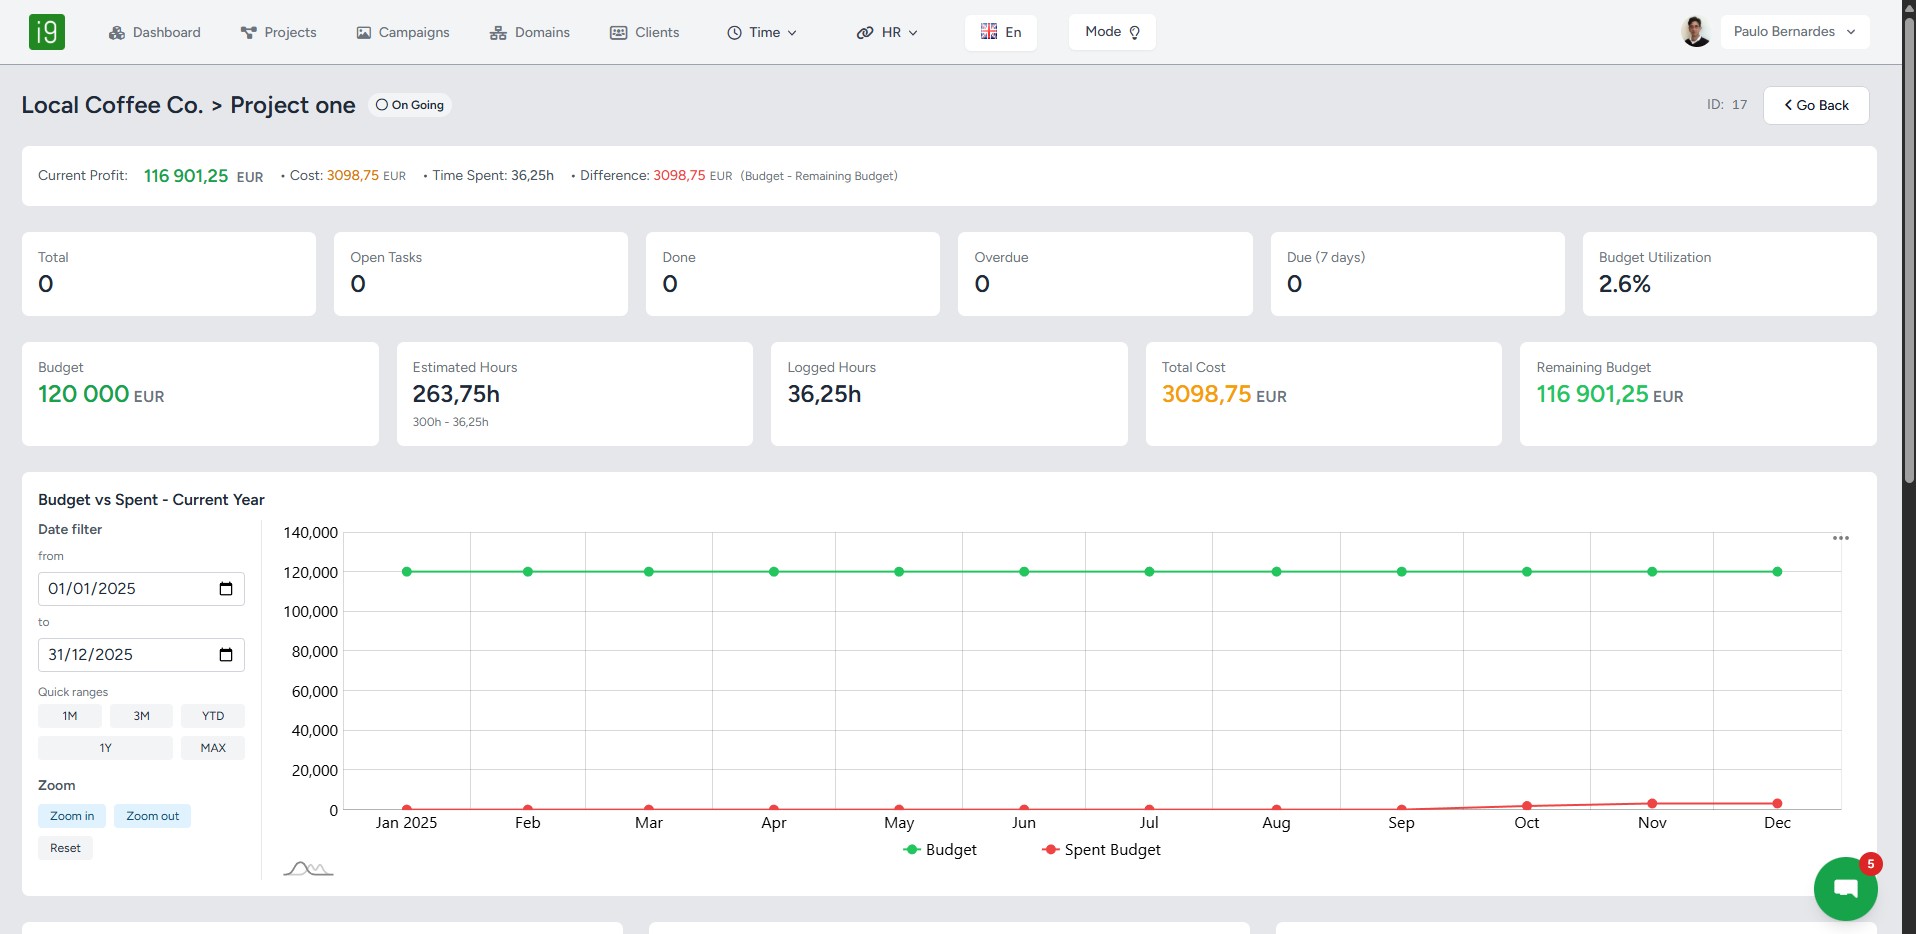
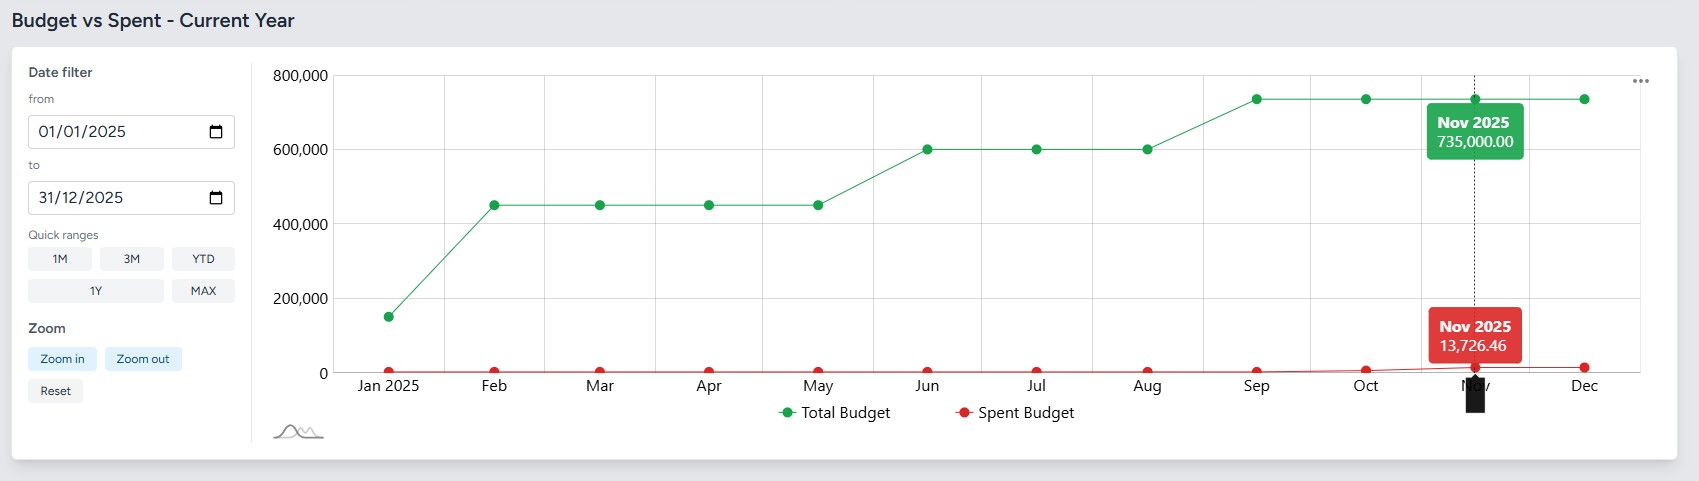
Global Overview: Presents a real-time summary of the entire portfolio, including total budget status and variance, visualized through interactive Charts.
The line graph, Budget vs. Spent, is fully dynamic, allowing managers to filter, zoom, and analyze specific date ranges for trend identification.
Project Detail Statistics: Provides granular analysis of individual project health, showing Budget Utilization, Total Cost, and resource Workload by Assignee.
User Detail Statistics: Transforms the user profile into a resource management dashboard, displaying individual Hours by Weekday, Project Involvement Costs, and time utilization metrics.
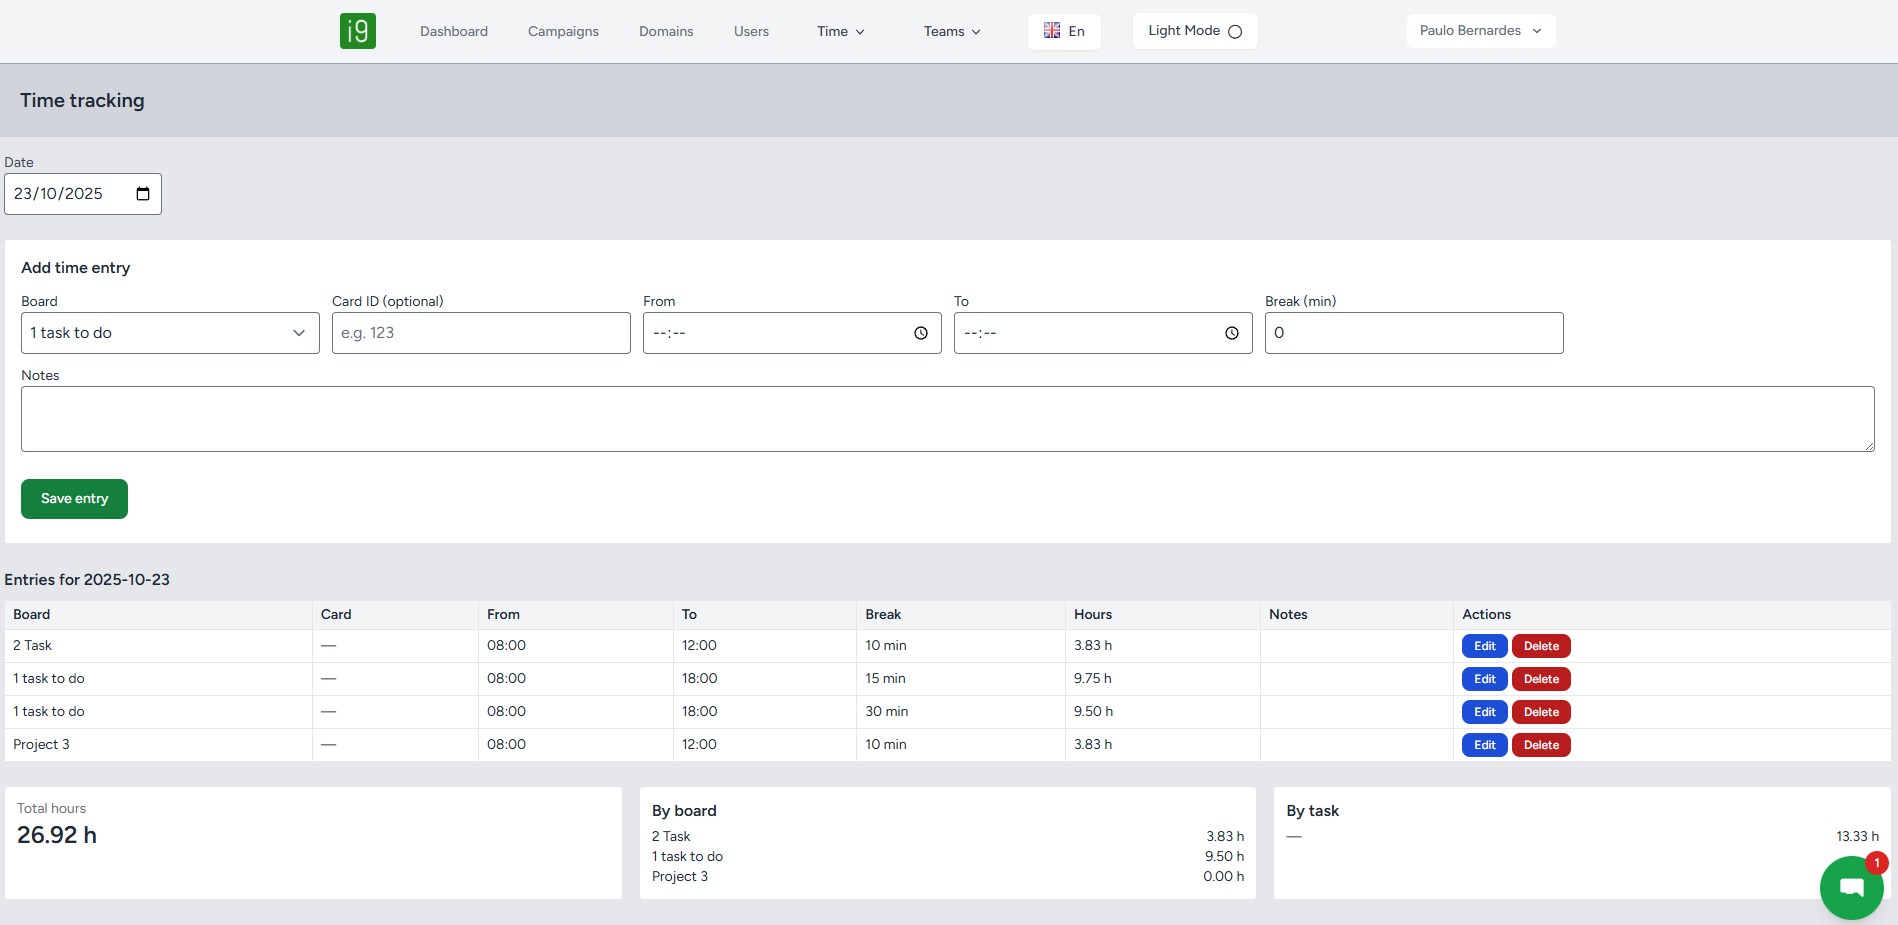
Dynamic Data Filtering: All tables throughout the application, including the Per-User Summary and the All Time Entries report, feature reactive filtering. All calculated totals (cost, hours, count) instantly update based on the applied search query, providing on-the-fly analysis without the need to generate a separate report.
III. Seamless Reporting and Dissemination
The final stage of the intelligence pipeline-reporting is automated. The ability to extract and share analysis is universal:
Universal Export Functionality: All generated insights are instantly portable. Every table and every amCharts visualization can be exported as a clean image format, PDF, or raw data file (XLSX, CSV, JSON). This eliminates the friction of manual reporting and ensures stakeholders receive accurate, up-to-the-minute data in their preferred format.
The architecture fundamentally redefines project management by converging execution with financial intelligence, guaranteeing that all project vital data is real-time, consolidated, and actionable.