
Dynamic Dashboard Creation for Joomla: Line, Bar, and Pie Chart Modules
Transform complex data into clear, compelling visuals directly on your Joomla site with this professional suite of Dynamic Chart Modules.
Featuring dedicated tools for Line, Bar, and Pie Charts, these modules give you complete control over your data presentation, ensuring your audience is informed and engaged.
3D Pie Chart
3D Pie Chart subtitle
Bar Chart 3D
3D Bar Chart subtitle
Chart Description
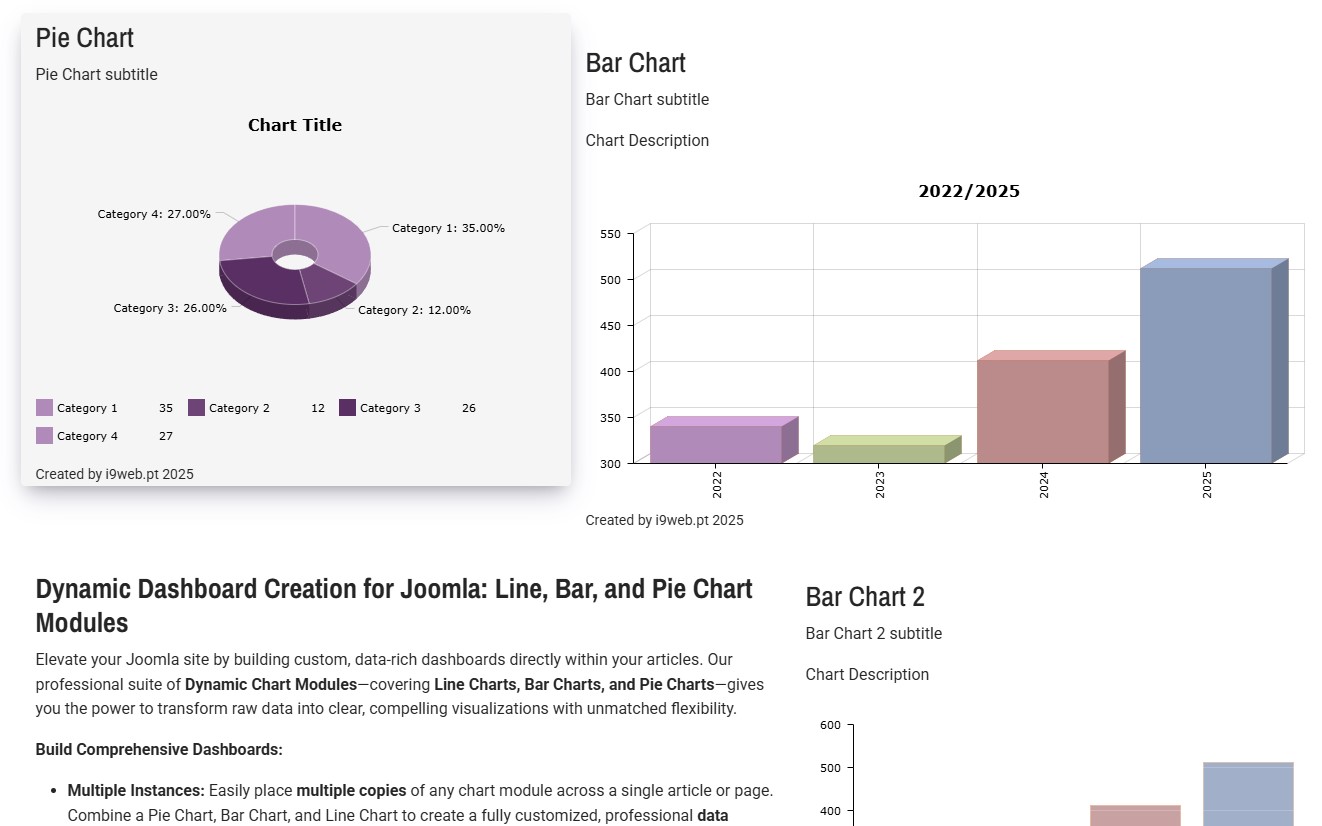
Elevate your Joomla site by building custom, data-rich dashboards directly within your articles. This professional suite of Dynamic Chart Modules, covering Line Charts, Bar Charts, and Pie Charts, gives you the power to transform raw data into clear, compelling visualizations with unmatched flexibility.
Build Comprehensive Dashboards:
- Multiple Instances: Easily place multiple copies of any chart module across a single article or page. Combine a Pie Chart, Bar Chart, and Line Chart to create a fully customized, professional data dashboard.
- Article Integration: Designed to integrate seamlessly, these modules allow you to embed dynamic visualizations directly into your Joomla articles, making your content data-driven and engaging.
Bar Chart 2D
Bar Chart 2D subtitle
Chart Description
Highlighting Key Features:
Unmatched Customization & Control:
- Visual Flair: Go beyond basic with controls for 3D rendering (where applicable), distinct Shadow effects, and customized Rounded Corners.
- Theming & Branding: Define the look with custom Colors for up to two data categories and set individual Labels for clear comparison.
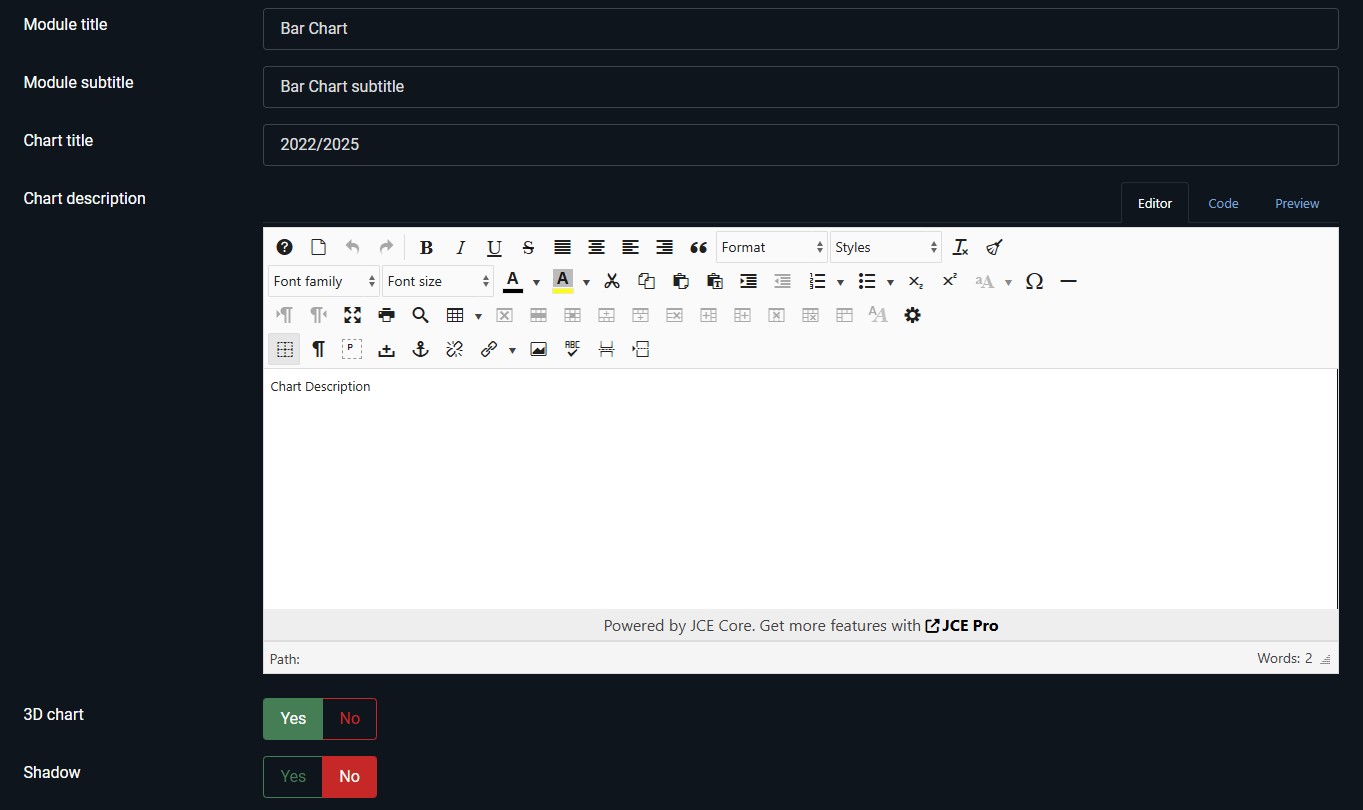
- Full Context: Utilize dedicated fields for Module Title, Chart Title, Description, and set the Legend Position (Header or Footer) for optimal presentation.
- Multilingual Ready: Reach a global audience with full localization in Portuguese (pt-PT), English (en-EN), and German (de-DE).
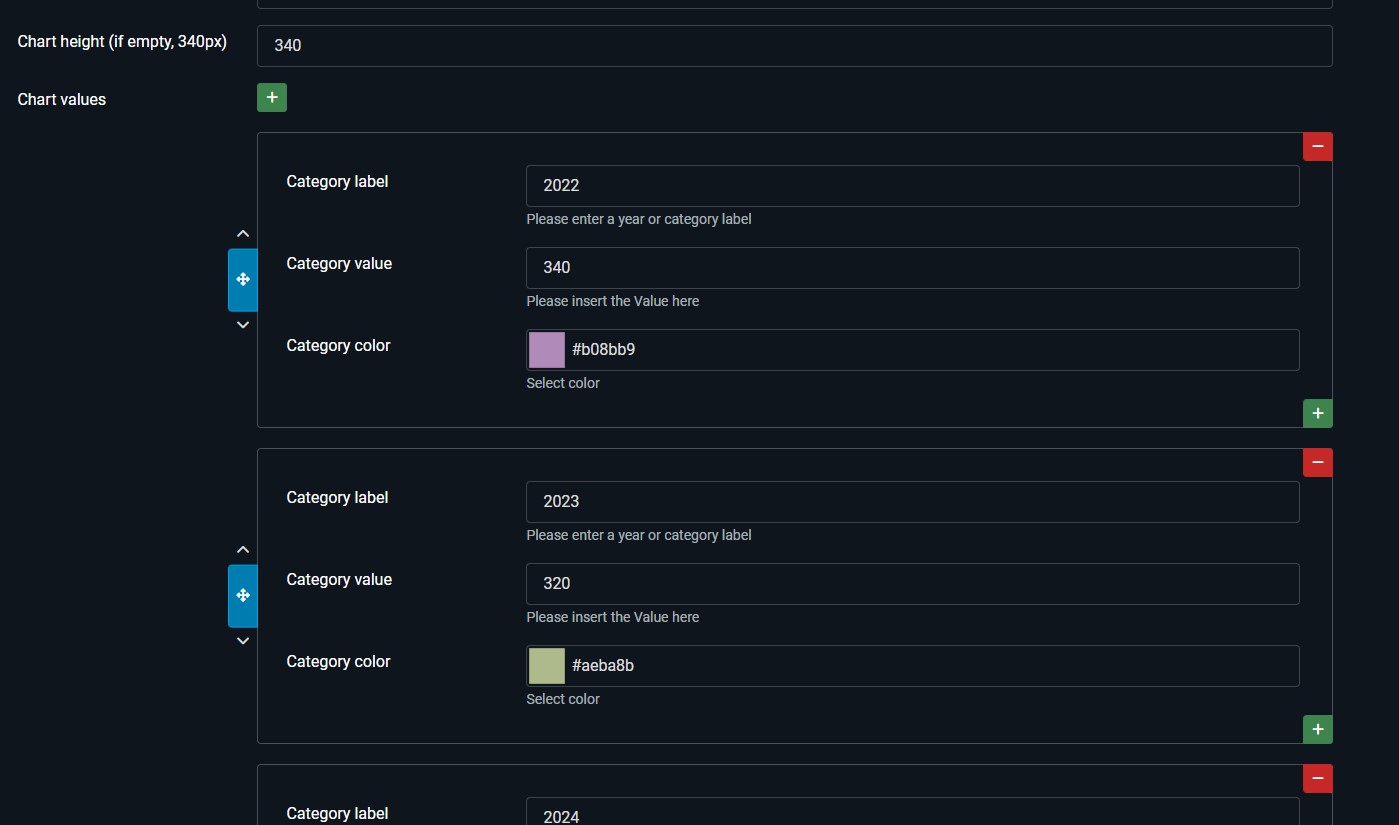
- Efficient Data Entry: Data points, including Dates and values, are managed quickly and intuitively through a powerful, repeatable subform interface.
Stop presenting static, dull numbers. Start empowering your content with dynamic, high-quality data dashboards.
- Complete Visualization Suite: Seamlessly integrate Line Charts, Bar Charts, and Pie Charts into any article or module position.
- Intuitive Customization: Go beyond basic charting with deep, user-friendly controls:
- Presentation Style: Choose from a 3D Chart view (where applicable), add Shadow effects, and customize with Rounded Corners.
- Layout Control: Define the Chart Height and set the Legend Position (Header or Footer) for optimal display.
- Branding & Theming: Easily select custom Colors for up to two distinct data categories and set individual Labels for clear comparison.
- Comprehensive Text Fields: Provide context with dedicated fields for the Module Title, Module Subtitle, Chart Title, and Chart Description.
- Multilingual Support: Ready for a global audience, the modules are fully localized in Portuguese (pt-PT), English (en-EN), and German (de-DE).
- Efficient Data Entry: Use the powerful, repeatable subform to input data points, including specific Dates and values for Category 1 and Category 2.
Pie Chart 2D
Pie Chart 2D subtitle
Stop relying on static images for chart presentation. Empower your content with dynamic, high-quality data visualization.
Line Chart subtitleLine Chart
Front Page
Administration
How to Create a Dashboard on a Joomla Article
Creating a dynamic data dashboard in a Joomla article is straightforward, thanks to the core Content - Load Modules plugin and the ability to use multiple copies of our Chart Modules.
This process involves three main steps: creating and configuring your chart modules, finding their unique IDs, and embedding them into your article's HTML structure.
Step 1: Create and Configure Your Chart Modules
- Go to Extensions > Modules in your Joomla Administrator Panel.
- Create New Modules:
- Click New and select one of your chart types (e.g., Line Chart).
- Give it a unique title (e.g., "Monthly Sales - Line Chart").
- Go to the configuration tabs and enter all your data, set custom colors, and choose your visual options (Shadow, Rounded Corners, etc.).
- Crucially, set the Position field to a position name that is not used by your template (e.g., simply type hidden-pos and press Enter). This prevents the module from appearing twice.
- Set the Status to Published.
- Set the Menu Assignment to No Pages (or a specific page if required, but setting to No Pages is safer for articles).
- Save & Close.
- Repeat: Create and configure a second module (e.g., a Bar Chart) and a third (e.g., a Pie Chart), following the same steps.
Step 2: Get the Unique Module ID (loadmoduleid ID)
To ensure you load the exact module you configured, the most reliable method is to use its unique ID number.
- Stay in Extensions > Modules.
- Locate the modules you just created.
- Look for the ID column on the far right of the module listing.
- Write down the ID number for each of your chart modules.
| Module Title | Chart Type | Unique ID |
| Monthly Sales - Line Chart | Line Chart | 123 |
| Market Share - Pie Chart | Pie Chart | 124 |
| Q4 Performance - Bar Chart | Bar Chart | 125 |
Your embed code will use these numbers, e.g., {loadmoduleid Unique ID}.
Step 3: Insert the Modules into Your Article
- Go to Content > Articles and open the article where you want your dashboard to appear.
- Switch your editor to Code View (usually a < > button or "Source Code").
- Use the <div> structure you provided, replacing the placeholder ID with the actual unique ID number for each module.
Example Dashboard Layout (Two Columns):
Paste the following structure into your article's code view:
<div class="row">
<div class="col-sm-5">
{loadmoduleid ID}
</div>
<div class="col-sm-7">
{loadmoduleid ID}
</div>
</div>
<div class="row">
<div class="col-sm-12"> {loadmoduleid ID} </div>
</div>
Step 4: Save & Close the article.
When a user views the article, the Content - Load Modules plugin will parse the shortcodes, load your specifically configured Line, Bar, and Pie Charts, and display them neatly side-by-side (or stacked) within the responsive columns you defined—creating your dynamic dashboard!


